Reversing Technology
A blog on reverse engineering technology and reverse engineering technology.
Ghidra Dev without Eclipse Part 3: Debugging Java
Debugging works the same for scripts and Ghidra core, so this posts covers both cases. This also can be adapted slightly to debug the headless analyzer or anything else that implements the GhidraLaunchable interface and would be passed as the argument to GhidraLauncher.
The post mostly explains the IntelliJ setup, but because the IntelliJ setup relies heavily on specifying JVM arguments this easily works without an IDE too. Simply run the full java command with all arguments and add the debug parameters you wish and attach with whatever you want.
Attaching to a Running Instance
This way allows Ghidra to start how it usually would, but with a debug port IntelliJ can attach to. This is a useful reference, meaning if you can start Ghidra in debug mode but your IDE launch configuration crashes you can compare the two by attaching a debugger to both of them and comparing at which point they diverge.
This requires your IntelliJ to ptrace the Ghidra process, the magic word is ptrace_scope the rest is up to you. Read up on it and understand the implications before proceeding.
Starting Ghidra in Debug Mode
The first step is running Ghidra in debug mode. The simplest way to do this by running support/ghidraDebug. support/ghidraDebug is just a simple wrapper that sets some environment variables and then runs:
support/launch.sh debug Ghidra '' '' ghidra.GhidraRun
In some cases, like when trying to debug early launch code, you want the JVM to wait for the debugger to attach and set breakpoints:
support/launch.sh debug-suspend Ghidra '' '' ghidra.GhidraRun
Attach the IDE
In IntelliJ use Run->Attach to Process (Ctrl+Alt+5 on Linux) and select the Ghidra process. You can now set breakpoints and trigger them e.g. by loading the script you want to debug.
Happy debugging with full IDE support! 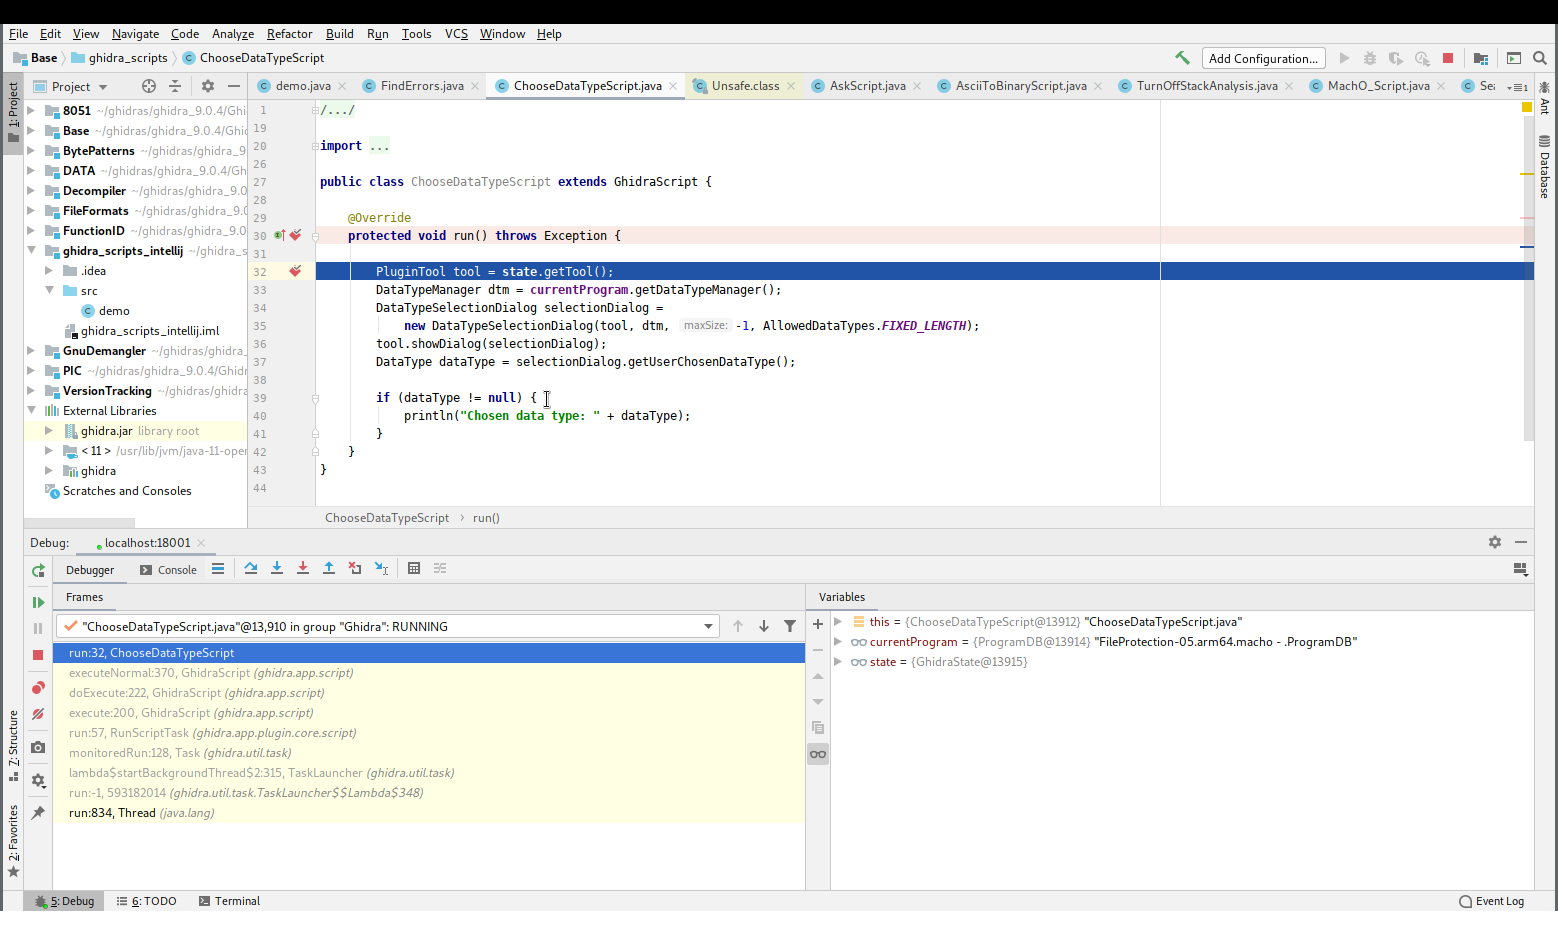
Setting up a Launch Configuration
Attaching is fairly annoying and the support/ghidraDebug script only works when run from a built release.
So for IDE integration and for debugging Ghidra core something else is required.
Reversing the Launch Command
Debug
So, what really happens when support/launch.sh debug-suspend Ghidra '' '' ghidra.GhidraRun is run? the easiest way to find out is by running:
bash -x support/launch.sh debug-suspend Ghidra '' '' ghidra.GhidraRun
This will print debug output of bash, most importantly the final java command that is invoked. This should be the second to last line, before Listening for transport dt_socket at address: 18001. The following is this one line on my machine formatted for readability:
/usr/lib/jvm/java-11-openjdk/bin/java
-Djava.system.class.loader=ghidra.GhidraClassLoader
-Dfile.encoding=UTF8
-Duser.country=US
-Duser.language=en
-Duser.variant=
-Dsun.java2d.opengl=false
-Dhttps.protocols=TLSv1,TLSv1.1,TLSv1.2
-Dghidra.cacerts=
-Dcpu.core.limit=
-Dcpu.core.override=
-Dfont.size.override=
-Dsun.java2d.pmoffscreen=false
-Dsun.java2d.xrender=true
-Dsun.java2d.uiScale=1
-Dawt.useSystemAAFontSettings=on
-Xdebug
-Xnoagent
-Djava.compiler=NONE
-Dlog4j.configuration=./support/debug.log4j.xml
-Xrunjdwp:transport=dt_socket,server=y,suspend=y,address=127.0.0.1:18001
-showversion
-cp ./support/../Ghidra/Framework/Utility/lib/Utility.jar
ghidra.GhidraLauncher ghidra.GhidraRun
Regular
Some of the previous look like they are only relevant for debugging, so run
bash -x ./support/launch.sh fg Ghidra '' '' ghidra.GhidraRun
/usr/lib/jvm/java-11-openjdk/bin/java
-Djava.system.class.loader=ghidra.GhidraClassLoader
-Dfile.encoding=UTF8
-Duser.country=US
-Duser.language=en
-Duser.variant=
-Dsun.java2d.opengl=false
-Dhttps.protocols=TLSv1,TLSv1.1,TLSv1.2
-Dghidra.cacerts=
-Dcpu.core.limit=
-Dcpu.core.override=
-Dfont.size.override=
-Dsun.java2d.pmoffscreen=false
-Dsun.java2d.xrender=true
-Dsun.java2d.uiScale=1
-Dawt.useSystemAAFontSettings=on
-showversion
-cp ./support/../Ghidra/Framework/Utility/lib/Utility.jar
ghidra.GhidraLauncher
ghidra.GhidraRun
Note the lack of the following arguments implying that they are only relevant for debug mode.
-Xdebug
-Xnoagent
-Djava.compiler=NONE
-Dlog4j.configuration=./support/debug.log4j.xml
-Xrunjdwp:transport=dt_socket,server=y,suspend=y,address=127.0.0.1:18001
Because both of these commands might result in different VM arguments on your machine I recommend that you check yourself what your system uses.
Most of the options are not relevant and don’t need to be changed. Important to note are:
-Djava.system.class.loader=ghidra.GhidraClassLoader
Ghidra uses their own class loader.
-cp ./support/../Ghidra/Framework/Utility/lib/Utility.jar
This specifies a custom class path.
ghidra.GhidraLauncher ghidra.GhidraRun
These are the actual arguments, ghidra.GhidraLauncher is the class which main is run, and ghidra.GhidraRun is the first argument. At this point this is just a string argument, but will later be interpreted as a reference to a class that will be loaded by ghidra.GhidraLauncher
Translating to an IntelliJ Run/Debug Configuration
The following applies for launching a regular build. Some adjustments are required for a development mode setup, those will be explained in the section Development Mode
Open Run-> Edit Configurations..., click the +, create a new Application configuration and give it a meaningful name.
The fresh one should look like this:
![]()
Main class
This should be ghidra.GhidraLauncher, nothing more. Note that even adding a space after due to copy-and-paste will lead to IntelliJ complaining about being unable to find the module.
VM options
Add the various irrelevant ones gathered above.
-Djava.system.class.loader=ghidra.GhidraClassLoader
-Dfile.encoding=UTF8
-Duser.country=US
-Duser.language=en
-Duser.variant=
-Dsun.java2d.opengl=false
-Dhttps.protocols=TLSv1,TLSv1.1,TLSv1.2
-Dghidra.cacerts=
-Dcpu.core.limit=
-Dcpu.core.override=
-Dfont.size.override=
-Dsun.java2d.pmoffscreen=false
-Dsun.java2d.xrender=true
-Dsun.java2d.uiScale=1
-Dawt.useSystemAAFontSettings=on
-cp {GHIDRA_ROOT}/support/../Ghidra/Framework/Utility/lib/Utility.jar
You MUST NOT have a line like
-Xrunjdwp:transport=dt_socket,server=y,suspend=y,address=127.0.0.1:18001
in there. IntelliJ will add this with a dynamic port and only when starting in debug mode.
You must have the additional line of
-cp {GHIDRA_ROOT}/support/../Ghidra/Framework/Utility/lib/Utility.jar
so the started Ghidra knows where to find its classes. {GHIDRA_ROOT} is the full path to your Ghidra Install which you want to use.
I do not know if -Djava.compiler=NONE and -Dlog4j.configuration=./support/debug.log4j.xml will be added by IntelliJ, so you could add them, note that the first one will reduce performance.
Environment variables
Leave blank unless you know what you need to put in there.
Program arguments
ghidra.GhidraRun goes here. If you want to start headless use ghidra.app.util.headless.AnalyzeHeadless instead, followed by the actual arguments you would normally pass to ./support/analyzeHeadless. This is quite useful for debugging actual issues in auto analysis code because you can just set a breakpoint, start the headless config in debug mode and your breakpoints will be hit without any GUI interaction being necessary.
Working directory
Choose whatever you want or just leave it as is.
Use classpath of module
Select the Base module here so IntelliJ does not complain about being unable to find ghidra.GhidraLauncher. This is overwritten with the -cp argument in the VM options and should not be relevant for the runtime.
`Include dependencies with “Provided” scope
I leave this unchecked, though I do not know what this does exactly. Skimming the documentation hints at something about dependencies that are usually only available at compile time.
JRE
Default should work.
Before launch: Activate tool window
Remove the build action here so IntelliJ does not try to build your scripts, which might break due to it being unable to find libraries or just waste time.
Result
The result should look roughly like 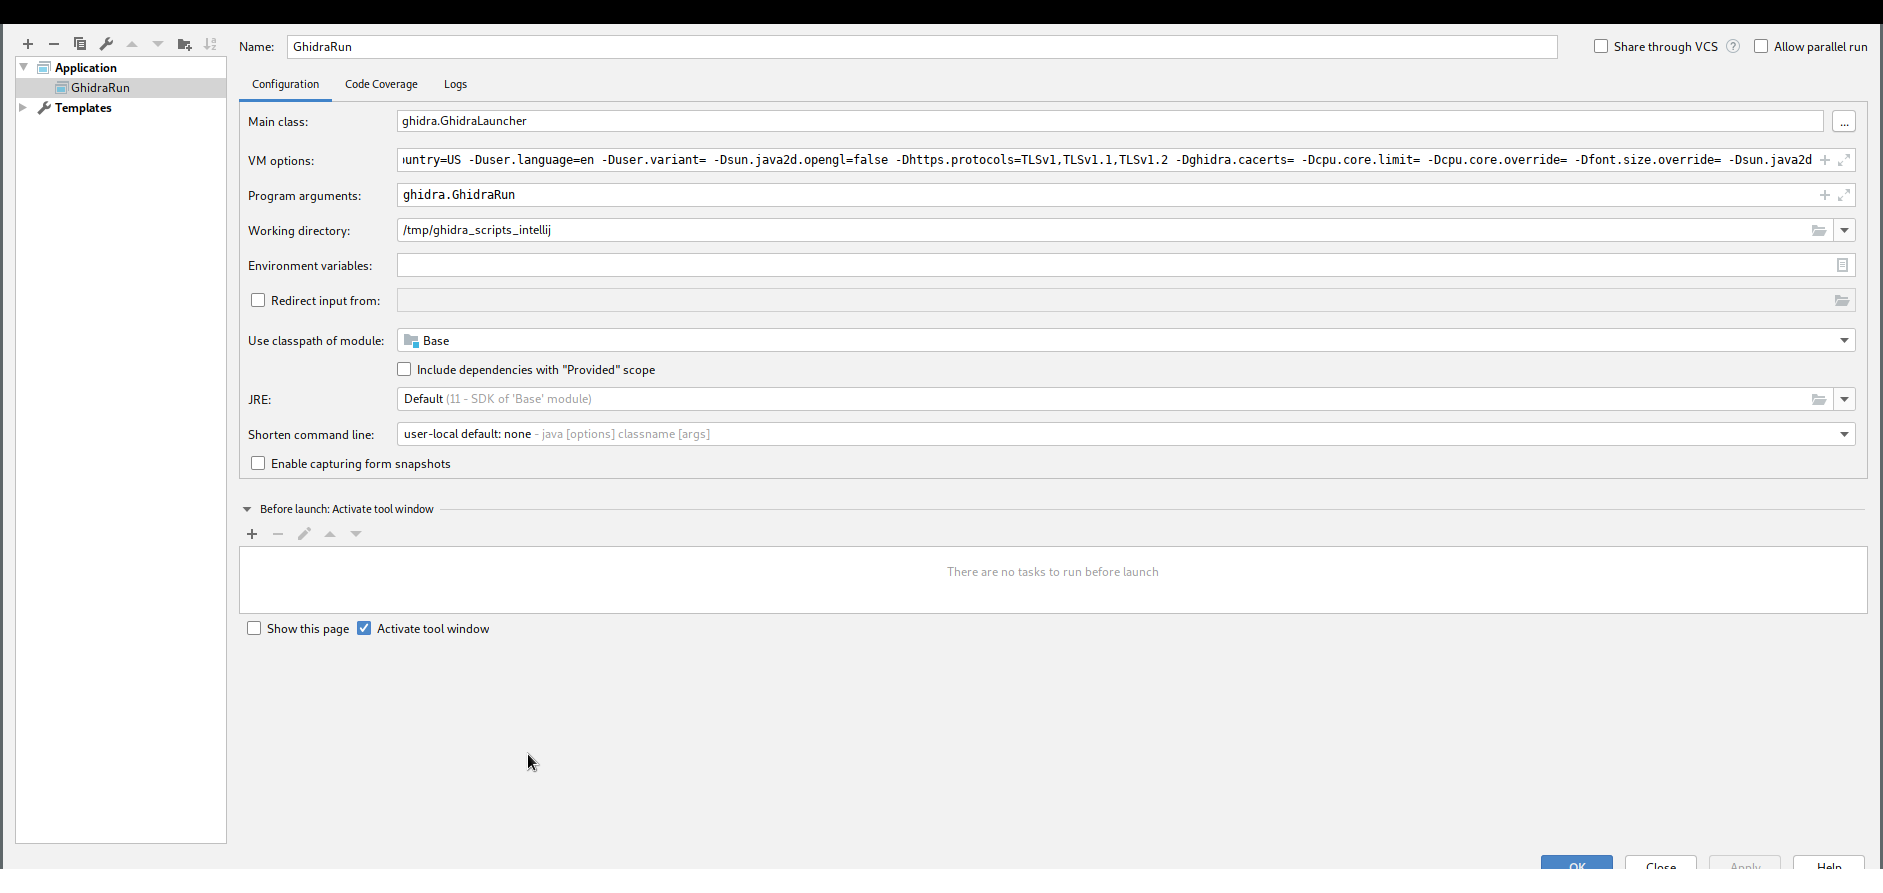
Development Mode
If you want to run your own source tree without building a release first and try to use these VM arguments, you will probably crash fairly early in the GhidraLauncher class, specifically in the line
Class<?> cls = ClassLoader.getSystemClassLoader().loadClass(args[0]);
with
Exception in thread "main" java.lang.ClassNotFoundException: ghidra.GhidraRun
	at java.base/java.net.URLClassLoader.findClass(URLClassLoader.java:471)
	at java.base/java.lang.ClassLoader.loadClass(ClassLoader.java:588)
	at java.base/java.lang.ClassLoader.loadClass(ClassLoader.java:521)
	at ghidra.GhidraLauncher.main(GhidraLauncher.java:70)
For a development setups various options are different and will be explained in the following section. The options not specified again are the same as for the regular setup.
VM Options
The VM options from the release setup still apply, only the -cp one needs to be changed. The other two are added.
Binary Path
The reason for the initial crash is that Ghidra expects the built class files to be in Eclipse specific locations. As of version 9.1 (specifically as of commit ab5e715607c319182a28426f524b8f6ac187850b) this location can be overwritten.
Add an additional VM option:
-DbinaryPath=build/classes/java/main:build/resources/main/:bin/default/:src/main/resources/
which will point the ghidra.GhidraClassLoader to the folders that contain the class files the gradle task classes compiled. The class loader also searches for resources in those locations so if it ever complains about being unable to find a resource, check where it is located and add the path relative to its module to this parameter. This is why src/main/resources/ is added despite being a source folder.
(Bootstrap) Class Path
The original classpath that specified a JAR can’t work either because this JAR doesn’t exist in a dev setup.
Add
-Xbootclasspath/a:./Ghidra/Framework/Utility/build/classes/java/main/
-cp ./Ghidra/Framework/Utility/
To specify the proper location. For some reason I can’t definitely remember why both the bootstrap classpath and the classpath are required. I think the bootstrap classpath allows the JVM to find the ghidra.GhidraClassLoader and the classpath is where the ghidra.GhidraClassLoader starts looking for classes and then uses it as a reference to find the Ghidra root directory and from there all other modules.
Use classpath of module
This should be overwritten by the -cp argument again, but to make IntelliJ happy specify Framework Utility
Before Launch
Because the main point of a development setup is developing you want to make sure that your classes are actually built before running. The default build action of IntelliJ tries to compile the ghidra_scripts and fails even when excluding the folders, so this has to be removed. Instead add the gradle task for the decompiler, e.g. decompileLinux64Executable and the task classes. Add --parallel as an argument for both for a substantial speed increase. This build is still incremental, so the decompiler will only be compiled once and only the classes that need to be recompiled will be.
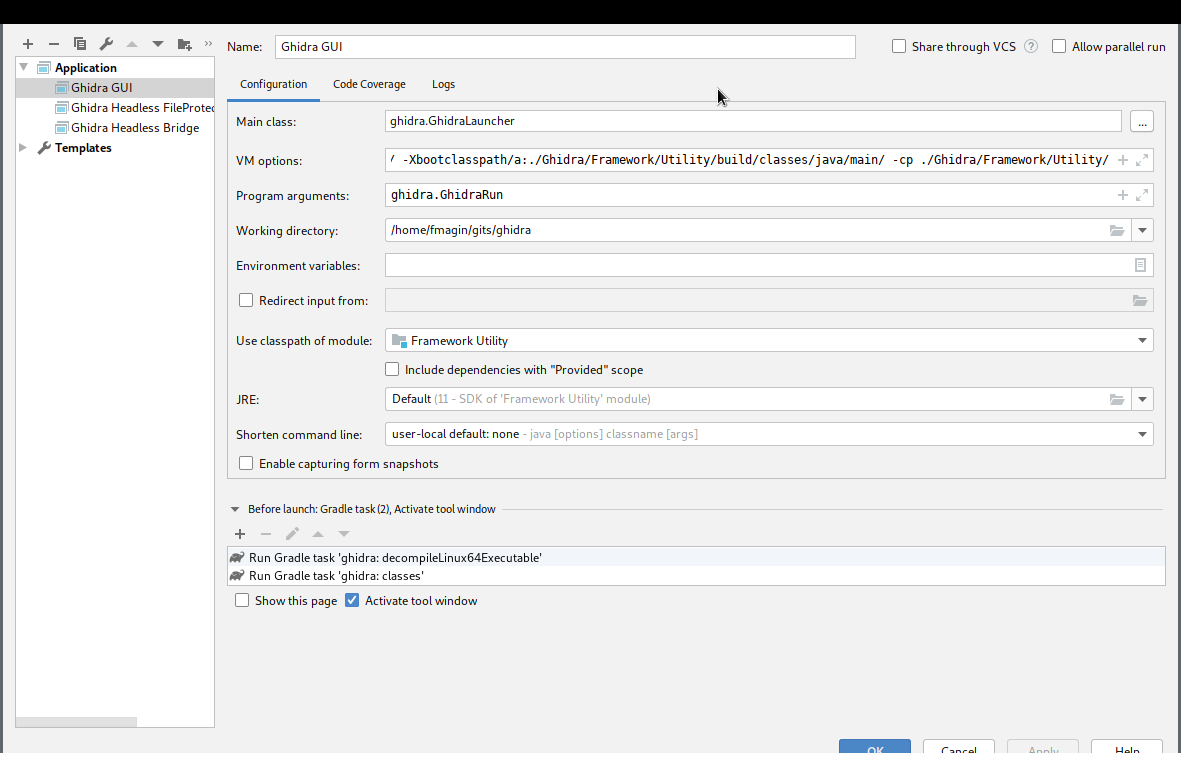
Result
The result should look roughly like this
Conclusion
This should cover every Java related debugging scenario for Ghidra. In case of extensions things might be slightly different but I haven’t tested this yet. I expect that the build process of the extension has to be setup somehow if not automatically collected by the classes gradle task. As long as the Ghidra instance that is launched finds your extension debugging it should work.
With this setup you are now equipped to develop and debug your own scripts. Simply set a breakpoint in your script and start either a headless config which calls your script or a GUI where you can run it manually. If you edit the script you can just rerun it from the existing Ghidra GUI being debugged, no need to restart this.